


We have pulled some statistics together here for your information
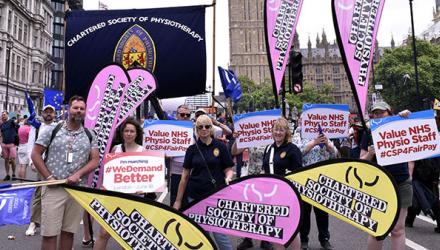
Some facts and figures about the LGBTQIA+ community and their experiences
- 2.2% of the UK population identify as lesbian, gay or bisexual (LGB)
An estimated 1.2 million people aged 16 years and over identify as LGB.
- The proportion of the UK population aged 16 years and over identifying as heterosexual or straight decreased from 95.3% in 2014 to 94.6% in 2018.
Source: Office of National Statistics – statistics on sexual orientation in the UK in 2018 Sexual orientation, UK - Office for National Statistics (ons.gov.uk)
Of the total sample
- 6.9% of respondents were non-binary (identifying as having a gender that was neither exclusively that of a man nor a woman)
- 3.5% were trans women (they had transitioned from man to woman at some point in their life)
- 2.9% were trans men (they had transitioned from woman to man)
- In 2017, the government ran a national survey of LGBT people, asking questions about people’s experiences of living in the UK and in accessing public services.
There were 108,100 valid responses from individuals aged 16 or over who were living in the UK and self-identified as LGBT or intersex.
Some of the headline results:
- 61% Respondents identified as gay or lesbian
- 26% Respondents identified as bisexual
- 4% Respondents identified as pansexual
- 2% Respondents identified as asexual
- 56% felt comfortable being LGBT in the UK, rating their comfort as a 4 or 5 out of 5
- 68% said they had avoided holding hands in public with a same-sex partner for fear of a negative reaction from others
- 70% said they had avoided being open about their sexual orientation for fear of a negative reaction
Of those who accessed or tried to access public health services:
- At least 16% had a negative experience because of their sexual orientation
- At least 38% had a negative experience because of their gender identity
- At least 21% of trans respondents said their specific needs were ignored or not taken into account when they accessed, or tried to access, healthcare services
Many had experienced a negative incident during their time in education:
- In the preceding academic year, 21% of respondents in education had experienced a negative reaction involving someone disclosing their LGBT identity without their permission, and 19% involving verbal harassment, insults or other hurtful comments
Number of subscribers: 1